

State & Territory Version 3 Transition Information
...and the status of Version 3 submission to NEMSIS


State Data Managers
Retrieve state data maps, software compliance information, and state reports.


Agencies & Clinicians
Review data to identify ways to improve care at the local agency level.


Researchers
Request the nation's largest publicly-available EMS dataset for analysis.


Software Developers
Follow the standard to implement new ePCR software products for local and state EMS systems.


EMS Educators
Promote the importance of data quality and performance evaluation through accurate documentation.


General Public
Discover how EMS data can improve patient care nationwide.

25,328,407
PCRs Year-to-Date

13,225
Reporting EMS Agencies

7 Minutes
Fastest Time from Record Completion to National Database Arrival
25,328,407
PCRs Year-to-Date
13,225
Reporting EMS Agencies
7
Fastest Time from Record Completion to National Database Arrival
These maps show the current status of State and Territory Partnership participation across states on our two data standard versions. As new states start submitting to the national database their color will change to green, and the national dataset will become more complete. Click on a state or territory for more information and check back often to see the country "go green".
LATEST NEWS
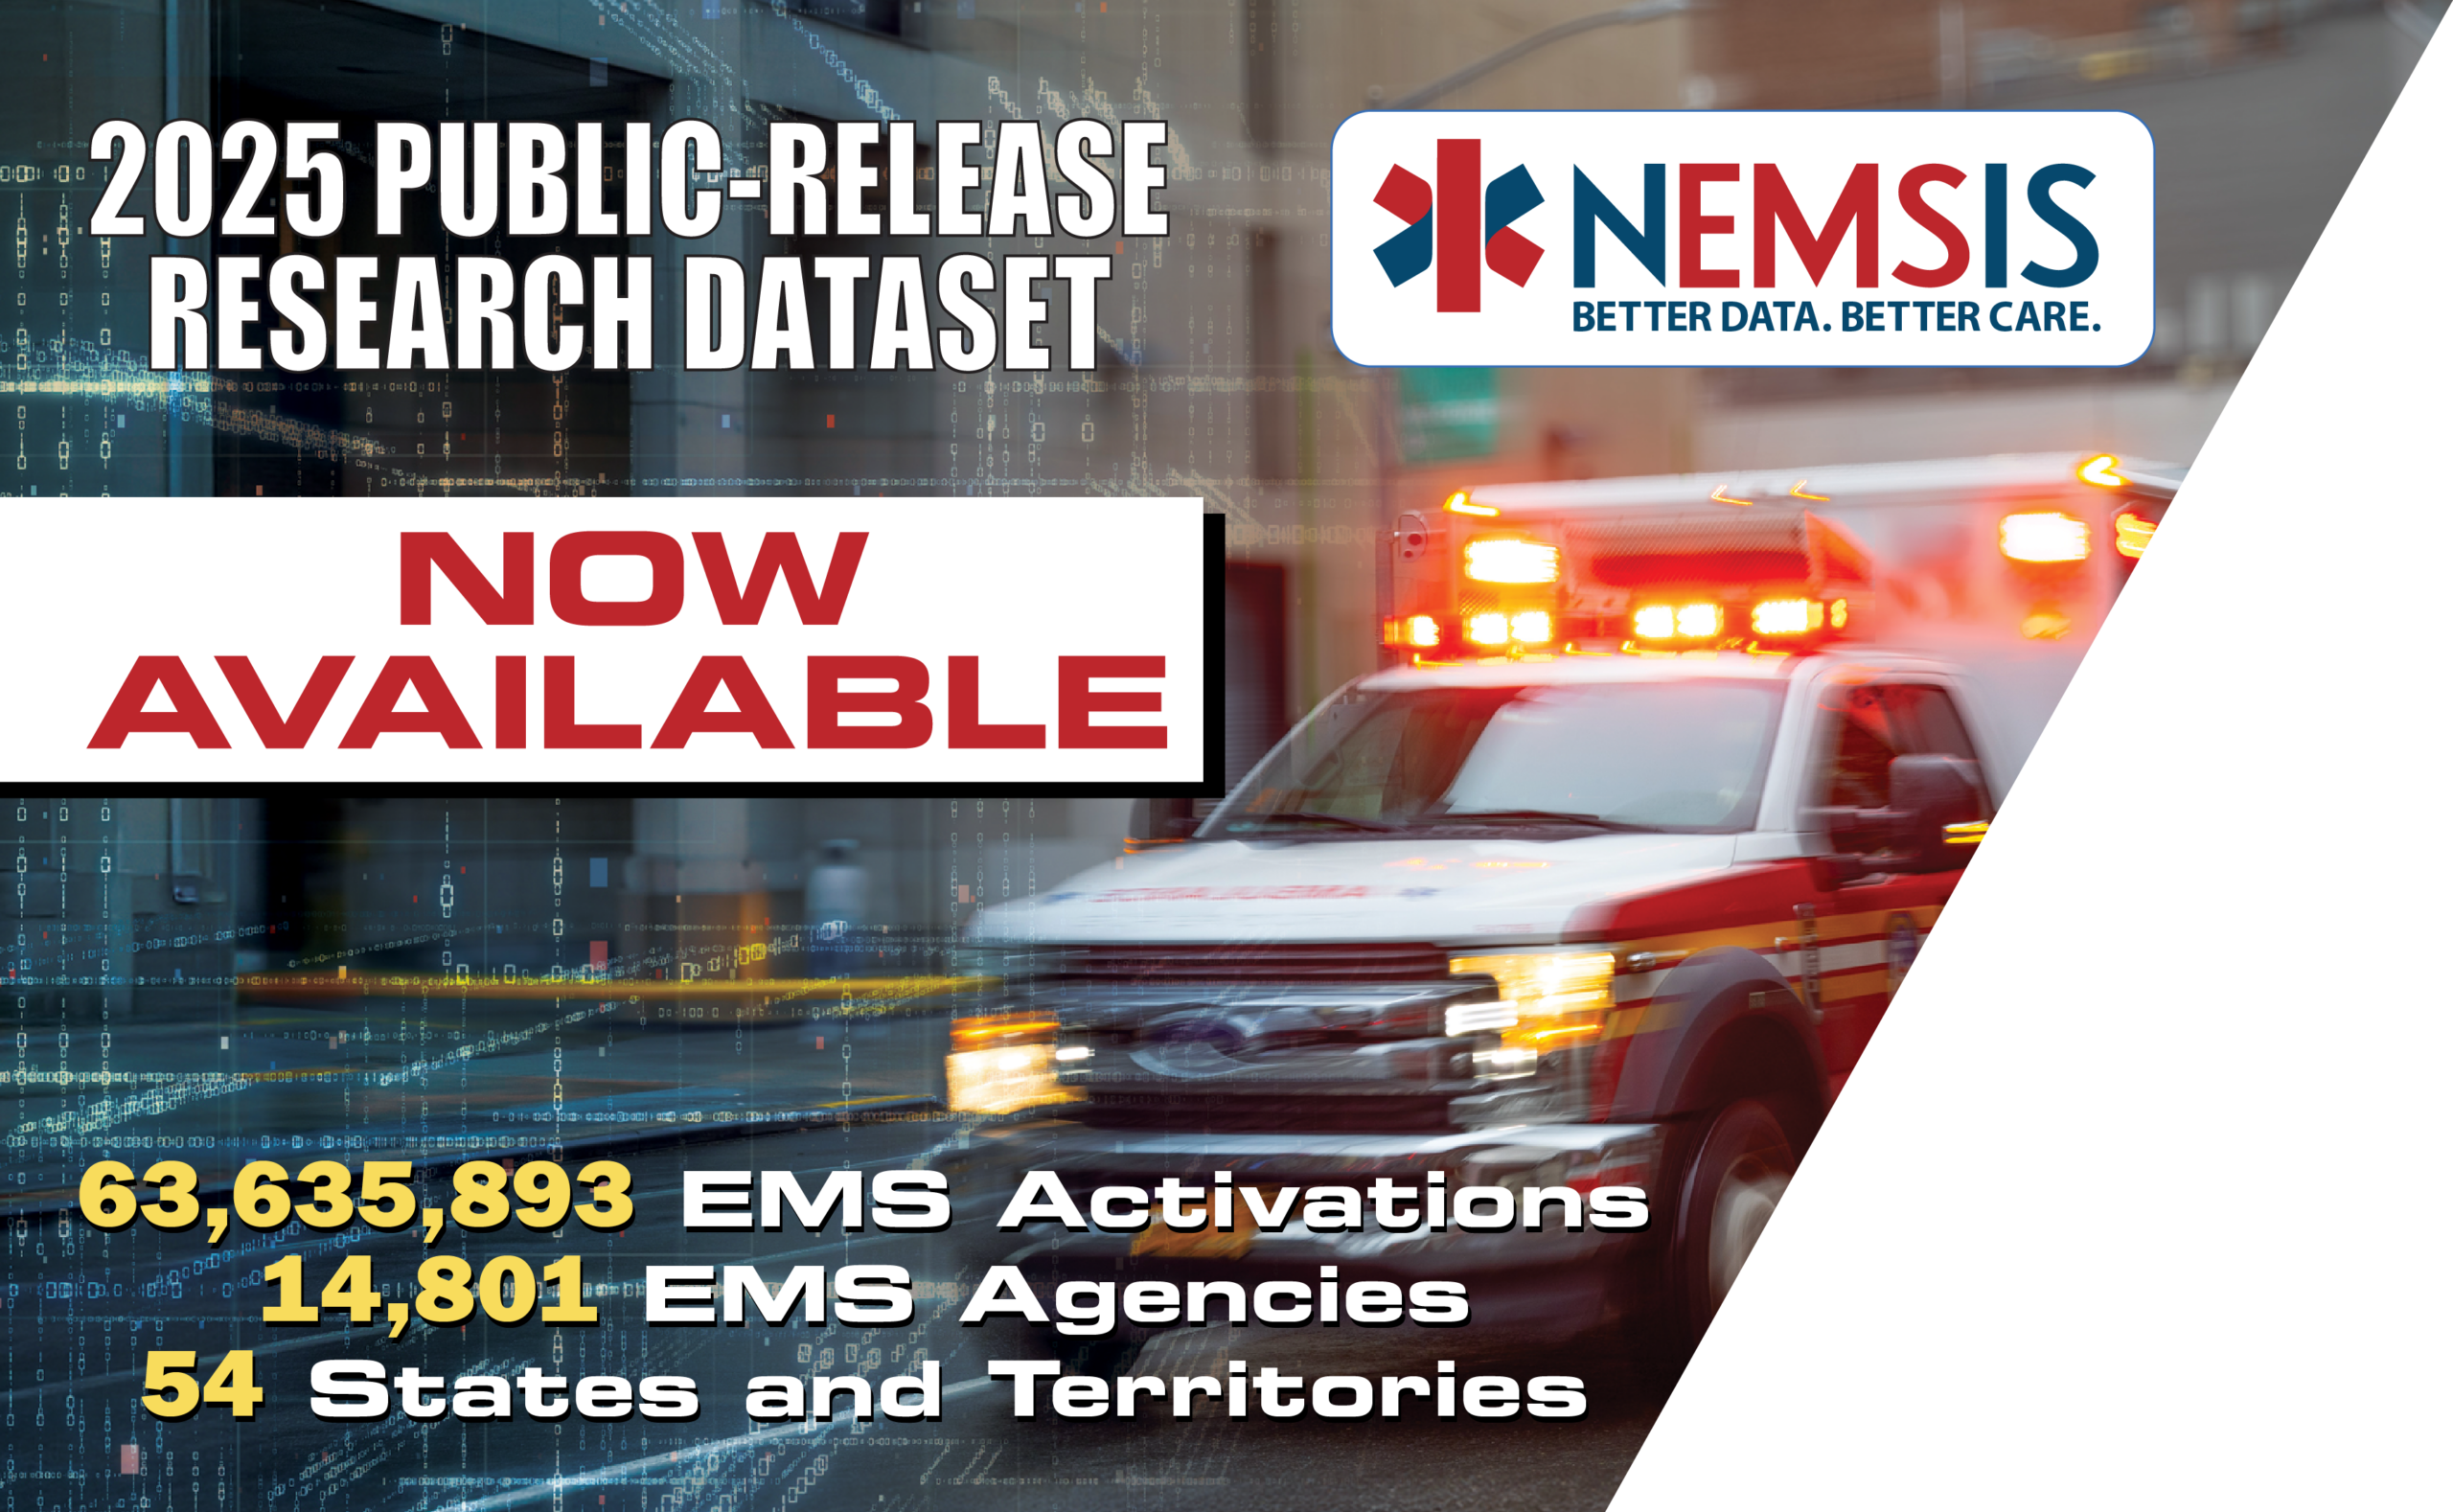
2025 NEMSIS Public-Release Research Dataset Now Available
May 6, 2026
The National Emergency Medical Services Information System Technical Assistance Center (NEMSIS TAC) announced today the availability of the 2025 Public-Release Research Dataset, the largest publicly available dataset of emergency medical service activations in the United States. Those interested in requesting a copy of the 2025 Public-Release Research Dataset can contact the NEMSIS TAC and fill […]
NEMSIS Violence Against EMS Personnel Dataset
April 25, 2026
The NEMSIS Violence Against EMS Personnel DataSet gives Local EMS agencies and states a standardized way to document threats, assaults, and any type of violent encounters, turning real‑world experiences into actionable safety data. The Violence Against EMS Personnel DataSet is fully aligned with NEMSIS Version 3, designed to integrate seamlessly into existing documentation workflows without duplicating […]
SOFTWARE VENDOR NEWS
2026 NEMSIS Annual Meeting
April 27, 2026
Join us for an important gathering to collaborate, share insights, and shape the future of emergency medical services. Date: October 6 – 9, 2026 Location: Black Rock Mountain Resort, Heber City, UT Stay tuned for additional details and agenda highlights. Hotel Link: https://be.synxis.com/?hotel=45542&group=1446344&arrive=10/2/26&nights=10&adult=2 Agenda 2026 Annual Meeting Data Manager Invitation Letter 2026 Annual Meeting Invitation Letter Activity Flyer […]
2025 NEMSIS Annual Meeting
January 29, 2025
Please join us for the NEMSIS 2025 Annual Meeting on August 26 – 29, 2025, in Park City, UT. We invite you to partner with the NEMSIS TAC and participate in robust communications and collaborations to strengthen EMS data collection and services in your state/territory/region. The meeting is an opportunity to collaborate, share insights, and tackle […]